Infographics are great communication tools and have been used through every media available. You can create beautiful Infographics by using Ms Excel. Try this step by step. Share and let me know if you liked :)
Those 3 images from the book Dynamic Infographics, can help you to understand the "VLOOKUP steps". Try the second image in your excel and follow the colors.
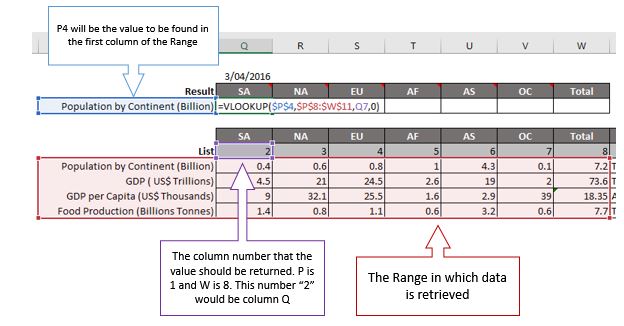
Blue - What are you looking for?
Red - Where do you want to search?
Purple: If you found, which column Excel will retrieve your data?
This book will help you learn the key concepts of MS Excel in less than 24 hours. You will create a budget control sheet with Upside and Downside, formatting, building graphics and preparing printing.
This book will help you to learn the Intermediate Level concepts of MS Excel 2016. You will create a Dynamic Infographic, formatting, building graphics, working with data validation, shapes, images, formulas (including the famous VLOOKUP and HLOOKUP), and more.
This book will help you learn the Intermediate Level concepts of MS Excel 2016 in less than 24 hours. You will create a professional Dashboard using PivotTable, formatting, building graphics, working with shapes, images, formulas, PivotCharts, and more.